Cruz Angel Ramírez González
Operations & technology · Monterrey, Mexico

I'm Cruz Angel Ramírez González, and I work on the dashboards and integrations a logistics company uses every day.

At a logistics and foreign-trade company, I own the CargoWise implementation, the system where every shipment is recorded. Besides running it, I built the data pipeline that pulls that information out of the system and turns it into the dashboards operations, finance, and management check every day. I also set up AI agents that record in CargoWise the payments coming from NetSuite, the quotes, and new clients.

You can open them below with sample data. They are the same files that run in production; the only difference is that the data is made up.

RoleOperations & Technology Analyst
EducationB.Eng. in Computer Systems
M.Sc. in Data Science, in progress
Based inGuadalupe, Nuevo León, Mexico
Emailcruzangelramirez26@gmail.com
Phone+52 81 1915 1885
Projects

Most recent

The current version of the company's dashboards, its extension to the customs brokerage in the United States, a personal project, and the portal that creates quotes directly in CargoWise. The first versions of the dashboards are further down.

Owner · 2026

Operations 2.0

  • Twelve dashboards in one app
  • Users, groups, and permissions
  • Global search
  • Data source monitoring

The second version of the dashboards. What used to be separate files now lives in a single application with users, groups, and permissions: each person sees only the dashboards they're authorized for, and data is requested with their own login.

It includes an admin panel, a monitor that shows whether each data source is up to date, the new KPIs, which explain in plain words why the team's score goes down, and a rates page where a new price is written into CargoWise by an AI agent.

The demo opens with an administrator account to show every dashboard. Changes you make in it aren't saved.
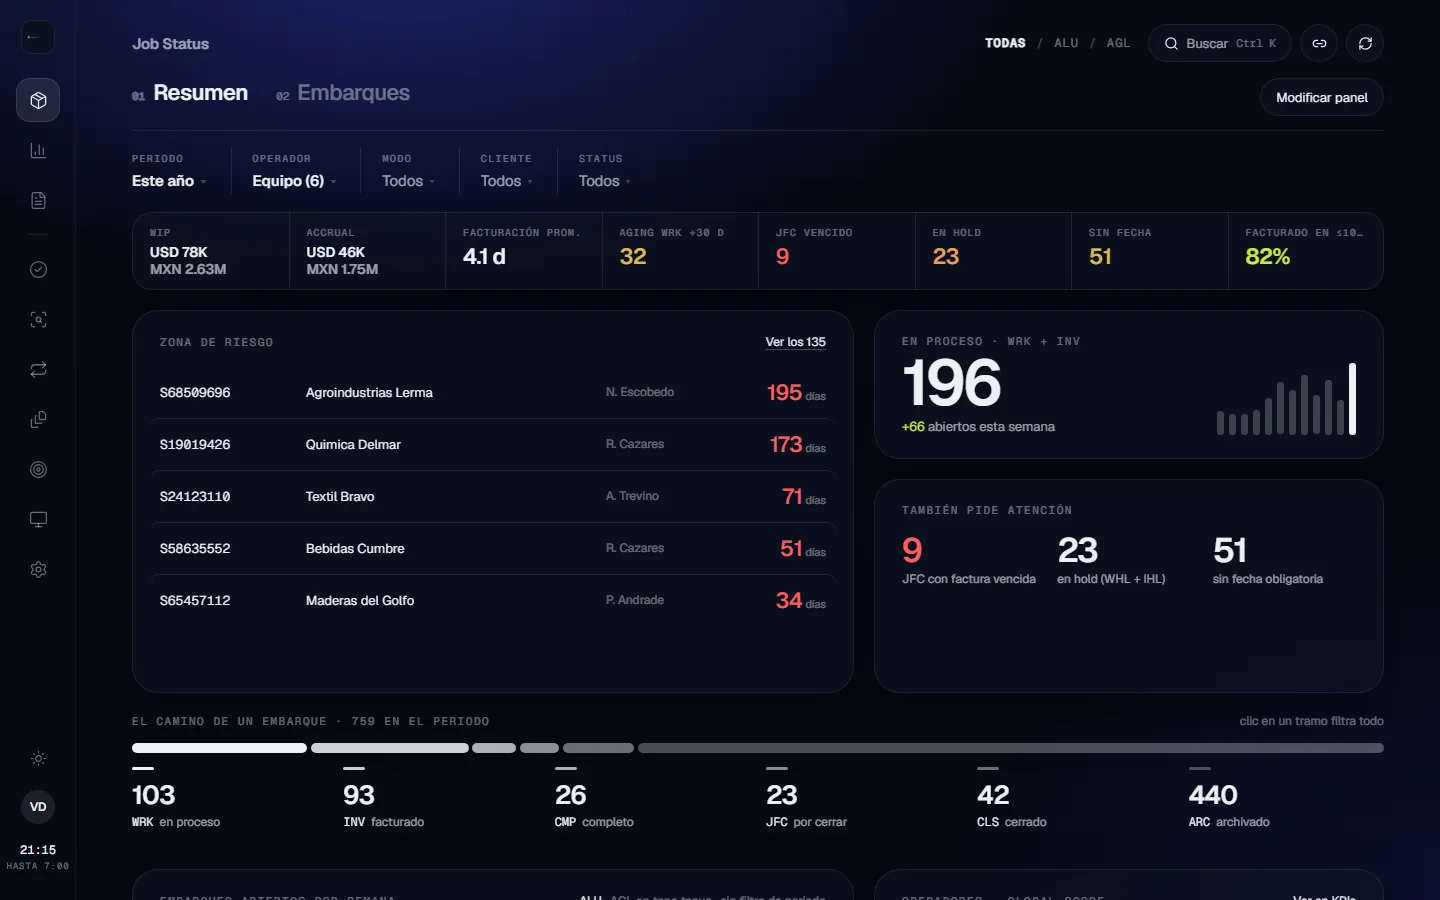
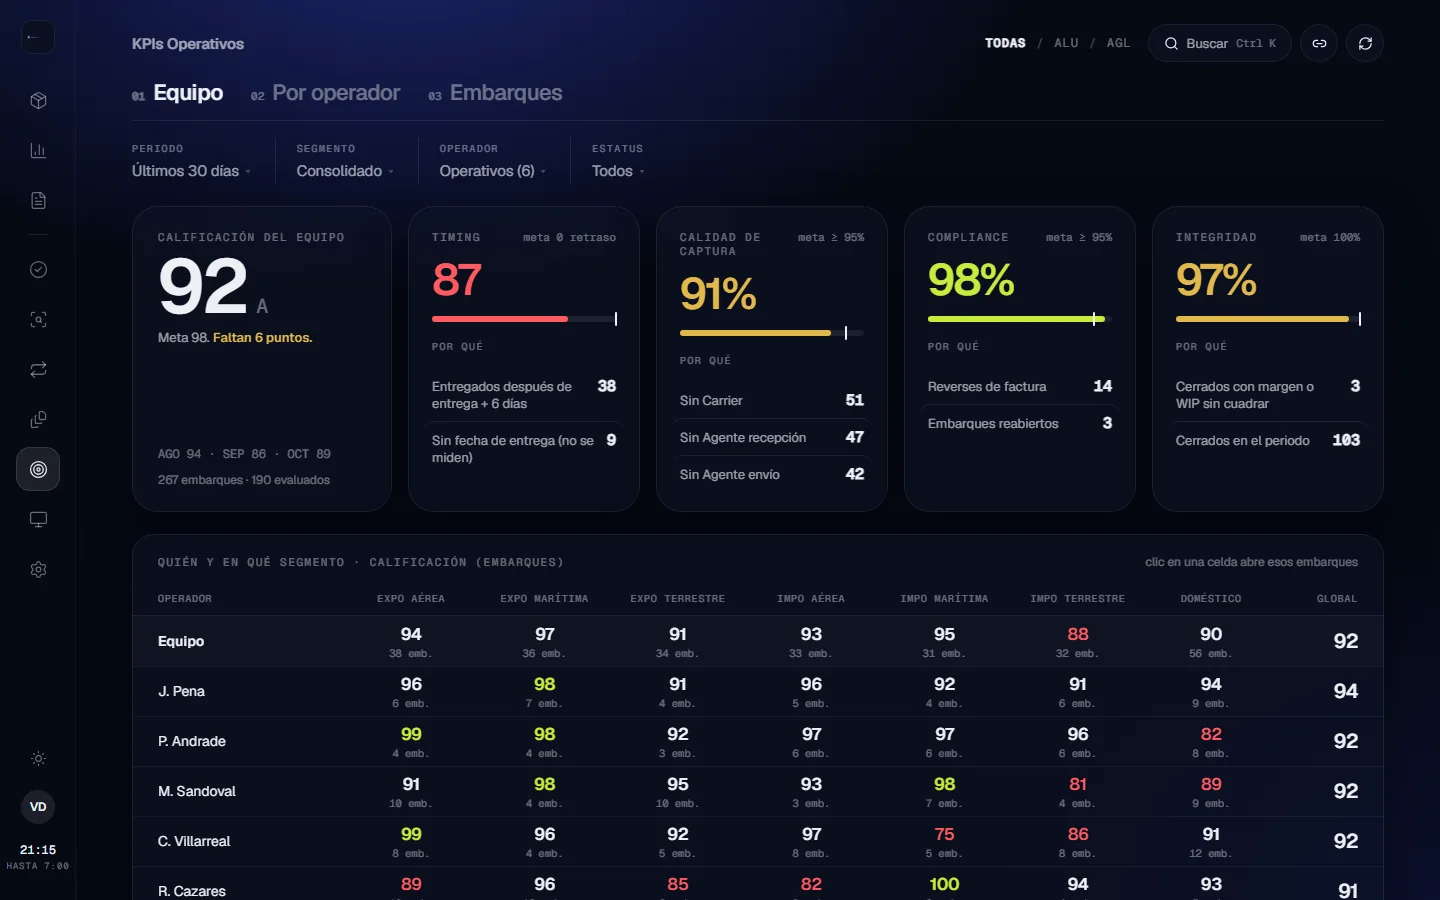
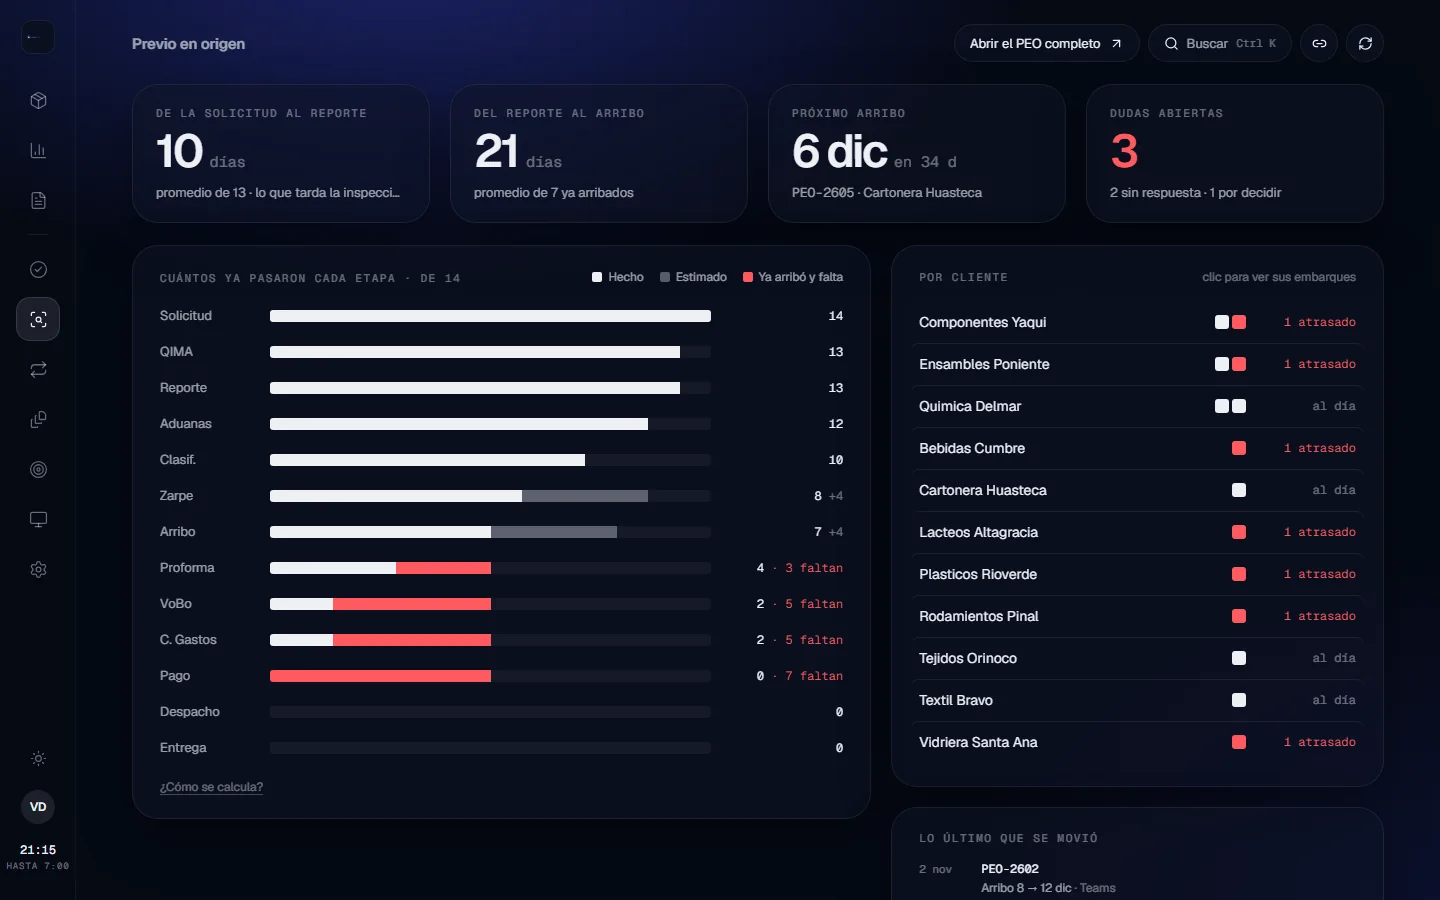
Job Status in Operations 2.0: risk zone, shipments in progress, and a shipment's path by status Operational KPIs: the team score and why it drops, by segment and by operator Pre-inspection at origin: how many shipments passed each stage and what moved last
Another business unit · Owner · 2026

CHB USA

The same base as Operations 2.0, taken to the company's customs brokerage in the United States. It started with an interview with the unit's director, and the first release shipped a week later: operations by person and client, the errors found when reviewing them, profitability by client, collections, and Excel and PDF reports. The data comes straight from the system the team works in.

Open demo →
Personal project · 2026

Rated

An app to rate the songs I listen to on Spotify. When I give a song a high rating, the app automatically adds it to my favorites playlists and my Liked Songs; if I lower the rating later, it takes it out.

It also counts how many times I play each song, something Spotify doesn't show. For that I imported my whole history back to 2018 (187,577 plays), and the app records what I listen to every 15 minutes.

It's built with Python (FastAPI) and a MySQL database, and runs on Google Cloud Run. It has web, desktop, and Android versions, with a notification and widgets to rate without opening the app.

  • Python · FastAPI
  • Google Cloud Run
  • MySQL
  • Spotify API

There's no open demo because it runs on my personal Spotify account. The screenshots are from the real app, with made-up songs and artists.

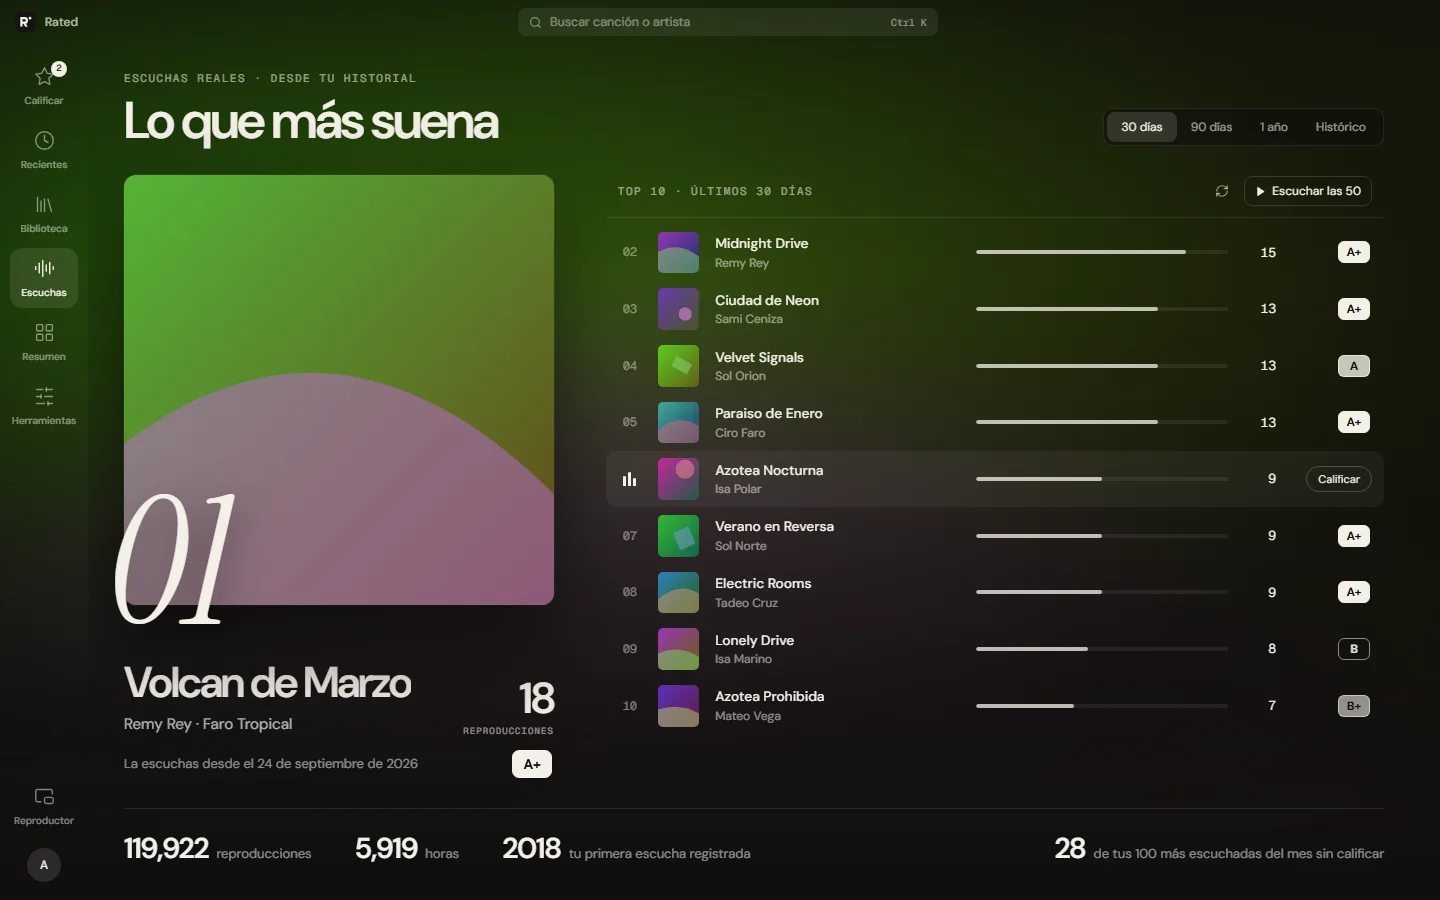
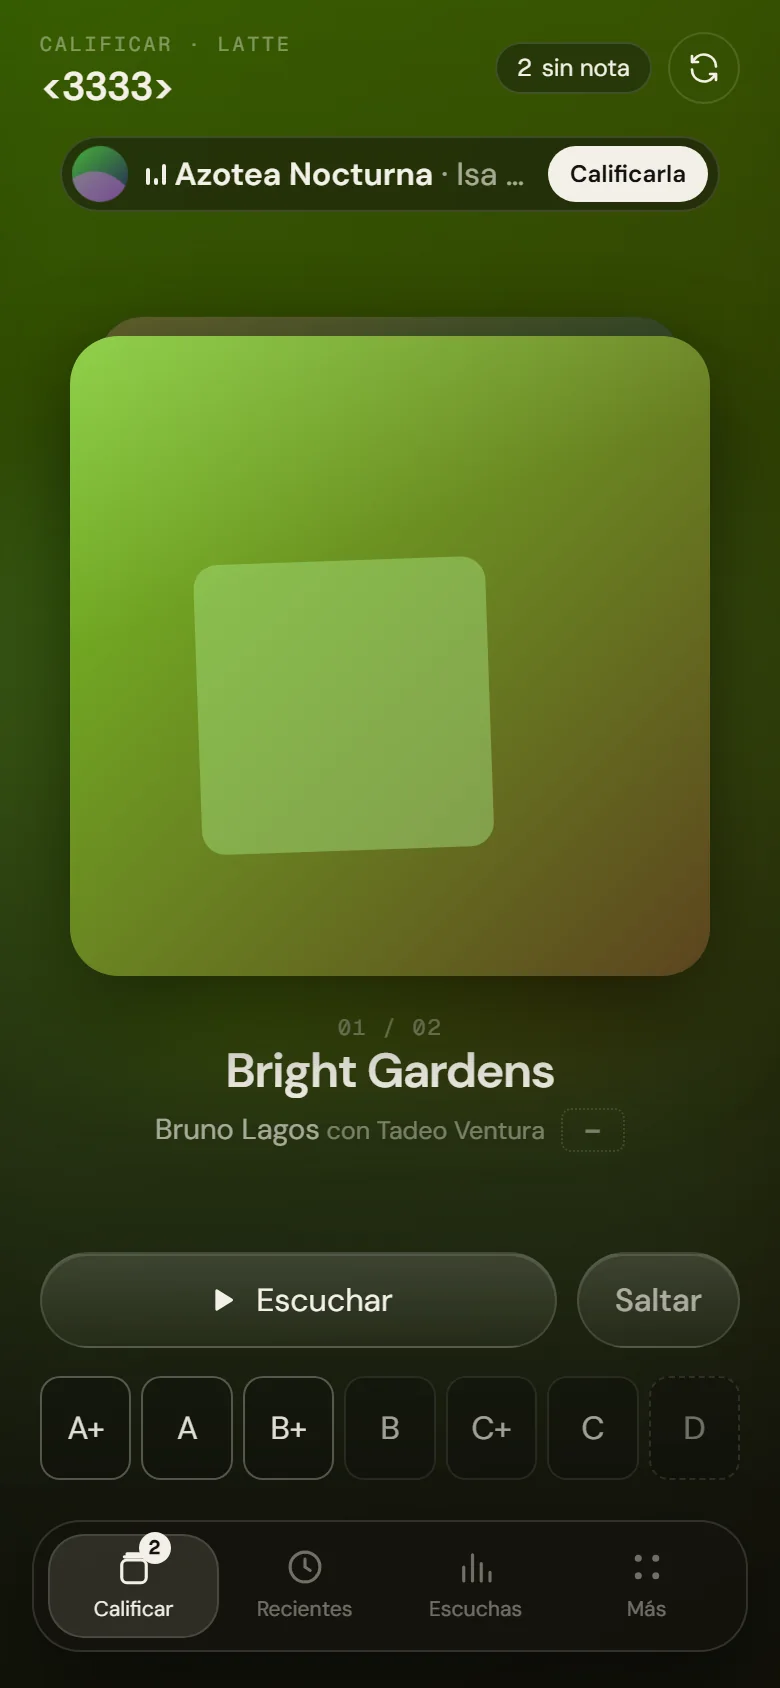
Rated on desktop: most played in the last 30 days Rated on the phone: rating the song that's playing
Creates quotes in CargoWise · Owner · 2026

Quoting Portal

The application the sales team uses to raise each request and Pricing uses to work it. Sessions with four roles, a form that changes with the mode (air, ocean, or road), an assistant that reads the client's email and fills in the fields, chat per request, and the button that creates the quote directly in CargoWise. In the demo, any email and password will get you in.

Open demo →
First versions

Where it started

Before Operations 2.0, each dashboard was a standalone HTML file with its own copy of the rules. They share the same data pipeline and can be opened just the same.

It's the production file

Not one line of logic was changed. fetch is intercepted and answered with what the webhook would return, from a deterministic generator: same filters, same calculations, same loading and error states.

The data is made up

Clients, amounts, reference numbers, operators, and brand are fictional. The data does deliberately reproduce the quirks of the real feed (empty fields, two currencies, rows duplicated per company), which is what the dashboard knows how to handle.

What doesn't work here

Export to Excel is disabled. The query panel answers with a local engine over the fake data, not a model; its demo PIN is shown on the screen itself.

How it's built

One pipeline for all of them

The dashboards run on the same pipeline. I built it once and reuse it: adding a new dashboard usually doesn't mean new infrastructure, just one more query over what's already published.

CargoWise and NetSuite

Source

The systems drop scheduled reports into a folder on a Windows VM. Not everything the business needs is exposed through an API.

Python watcher

watchdog · pandas · openpyxl

Detects the new file, cleans it, converts it to JSON, and sends it. With a daily backup sweep, locks, and logging.

n8n self-hosted

Code node · MySQL nodes

Receives, normalizes, stores, and exposes a read webhook. A single place where the integration logic lives.

MySQL on AWS RDS

views · triggers · procedures

The consolidated history the ERP doesn't keep, split by company and currency in the model itself.

Dashboard in the browser

JavaScript · Chart.js

A self-contained HTML file that reads the webhook, builds the joins client-side, and is published to the internal portal.

Joins happen in the browser

Joins are done with a Map on the client, not in SQL or n8n. That keeps the webhook contract flat and stable: if a new dashboard needs another join, the integration layer isn't touched and the working ones aren't put at risk.

Never two currencies on one axis

The business bills in pesos and dollars, and a chart that adds them up gives a number that's hard to read. It became a rule of the design system, not a call left to whoever builds the dashboard.

From separate files to one app

In the first version, every fix had to be ported by hand to several dashboards, and there was no way to decide who sees what. Operations 2.0 puts the rules in one place and requests data with each person's session.

What's urgent gets a notification

Anything that needs action the same day, like a reconciliation mismatch, is written to Airtable and n8n posts it to the team's Teams channel. The dashboard is for looking things up, not for watching.

Stack

What I work with

DataPython · SQL · MySQL on AWS RDS (views, triggers, stored procedures) · pandas · openpyxl
IntegrationSelf-hosted n8n · REST APIs · webhooks · OAuth · Airtable API · Google Sheets API · Banxico API · Spotify Web API
CloudGoogle Cloud Run · Cloud Build · Cloud Scheduler · Secret Manager · AWS RDS
BackendFastAPI and Flask for small APIs · REST endpoint design
Data front endJavaScript · Chart.js · my own design system with tokens and a dark theme
Business systemsCargoWise Neo (implementation owner) · NetSuite (integration layer) · HubSpot · Airtable · Microsoft Teams
AI-assisted developmentClaude Code as my main build tool, with one rule of my own: plan and confirm first, then code · LLM integration via API in production workflows
ProcessFunctional discovery before automating · Git and GitHub · documentation under ISO 9001:2015 · user training
Contact

Happy to talk

I'm looking for data, integration, or automation roles, remote or in Monterrey. I'm glad to walk you through how any of these systems is built, what was hard, and what I would do differently today.